
K-WANG
+086-15305925923
Service expert in industrial control field!


Product
Article
NameDescriptionContent
Adequate Inventory, Timely Service
pursuit of excellence


Ship control system
Equipment control system
Power monitoring system
Current position:
新闻动态
newS
Brand
ABB RMIO-12C Inverter I/O Unit
ABB RMIO-12C Inverter I/O Unit
ABB RMIO-12C Inverter I/O Unit
The Analyzer Network is a critical component as
part of the end user’s installed base and must be
considered as a key item when planning for the
replacement of Legacy GC’s. The upgrade of the
Analyzer Network not only grant extended
protection associated with Cybersecurity
aspects, but also ensures the benefit to explore
the full potential of an updated Process Gas
Chromatograph installed base. ABB’s STAR Data
Management System meets those features,
allowing remote access to all networked analyzer
assets from a central control point.
The STAR Data Management System is a client server software platform that empowers users to
gain the maximum benefit from process analyzer
data. It is constituted by the STAR Client and STAR
Server. The Star Client is a remote user interface,
or portal into your analyzer network, for data
display and analysis and the Star Server is a
centralized sever for data collection and storage,
enabling statistical trending and reporting of
analyzer performance based on historical data.
The STAR Client software is single application for
viewing Process Analyzer Data Statistics,
Analyzer Availability Calculations, Maintenance
Logs, Trending and Reporting that also contains a
single launch portal for the Remote User
Interfaces (RUIs) of the PGC5000, NGC / PGC1000
and legacy products, including the PGC2000 and
3100 Series. It runs on user workstations located
anywhere on the analyzer network for data
display and analysis and establishes connection
to the STAR Server. Analyzer Data content can be
accessed and managed, such as GC reports,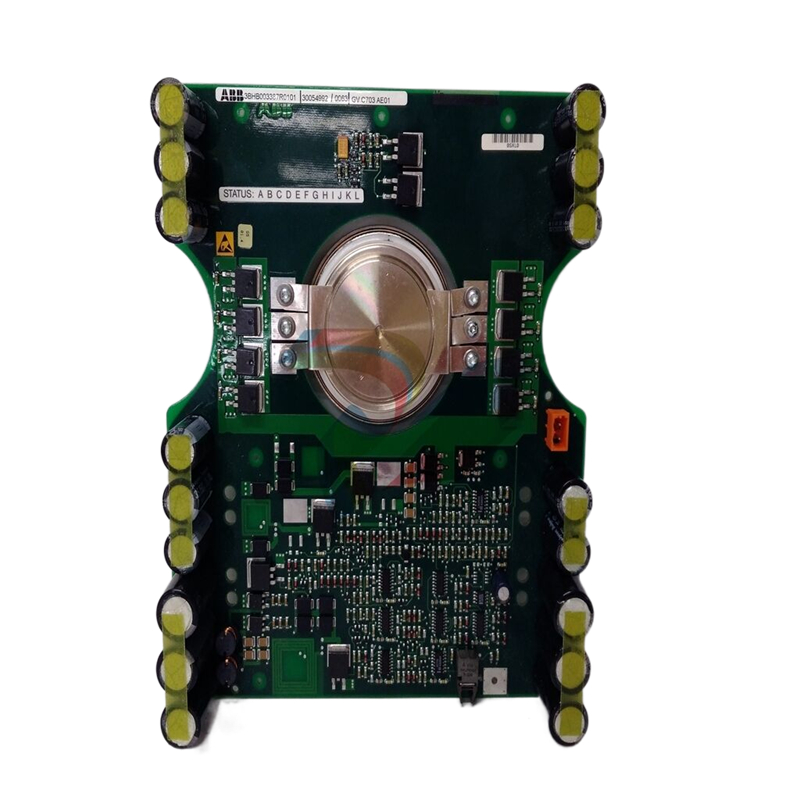
chromatograms, alarms, events, analyzer
documents and measurements, like components
concentrations. The Analyzer data can be
accessed in real time or when stored on the STAR
Server or on the SD card from the PGC5000A
Master Controller or PGC5000 Integrated
Controller oven.
Value added features:
• Plat View - End users can have a visual
perspective about the condition of the
analyzers. In the event of an alarm or issue with
any analyzer, a visual identification is
highlighted in the application, alerting the
Maintenance Department for a quick action.
• Analyzer Availability Calculation - Unique
feature highlighting the uptime and downtime
conditions of the analyzer installed base. Pie
chart can be generated per tag, showing the
analyzer health condition divided in 7 different
states of operation, displaying as % and total
hours.
• Maintenance Logs - Maintenance logs can be
added to each analyzer for the improvement of
maintenance history. Can be tied to the
maintenance flag in the analyzer.
• Analyzer Configuration, Upgrades and Log
Files – Remote capability for analyzer software
upgrades, troubleshooting, save and create
backup configurations.
• Overlays of Trends and Chromatograms –
Enhancing the troubleshooting ability of
analyzer devices.
• Export Data – Ability to export data for further
analysis.
- YOKOGAWA
- Reliance
- ADVANCED
- SEW
- ProSoft
- WATLOW
- Kongsberg
- FANUC
- VSD
- DCS
- PLC
- man-machine
- Covid-19
- Energy and Gender
- Energy Access
- Renewable Integration
- Energy Subsidies
- Energy and Water
- Net zero emission
- Energy Security
- Critical Minerals
- A-B
- petroleum
- Mine scale
- Sewage treatment
- cement
- architecture
- Industrial information
- New energy
- Automobile market
- electricity
- Construction site
- HIMA
- ABB
- Rockwell
- Schneider Modicon
- Siemens
- xYCOM
- Yaskawa
- Woodward
- BOSCH Rexroth
- MOOG
- General Electric
- American NI
- Rolls-Royce
- CTI
- Honeywell
- EMERSON
- MAN
- GE
- TRICONEX
- Control Wave
- ALSTOM
- AMAT
- STUDER
- KONGSBERG
- MOTOROLA
- DANAHER MOTION
- Bentley
- Galil
- EATON
- MOLEX
- Triconex
- DEIF
- B&W
- ZYGO
- Aerotech
- DANFOSS
- KOLLMORGEN
- Beijer
- Endress+Hauser
- schneider
- Foxboro
- KB
- REXROTH
- YAMAHA
- Johnson
- Westinghouse
- WAGO
- TOSHIBA
- TEKTRONIX
- BENDER
- BMCM
- SMC
- HITACHI
- HIRSCHMANN
- XP POWER
- Baldor
- Meggitt
- SHINKAWA
- Other Brands
- UniOP
- KUKA
- IBA
- Beckhoff
- ADLINK
51
-
ADLINK HPCI-14S12U - Industrial Control Backplane 12PCI Backplane PCI-14S Passive Backplane
-
ADLINK PCIe-GIE74C - image acquisition card 4-CH GigE Vision PoE+ Frame Grabber
-
ADLINK PCI-8164 - control card 4-Axis Advanced Motion Controller Board
-
ADLINK PCIe-U304 - 4 Port USB3 PCIe Frame Grabbers USB Screw Hole Card
-
ADLINK PCI-9112 - Multi-Function Data Acquisition Card DAQ Card
-
ADLINK PCI-7432 - 51-12013-0A50 4-CH Isolated Numérique I/O PCI Cartes Digital I/O Card
-
ADLINK PCA-6106P3-0C1 REV.C1 - backplane 6-Slot Passive Backplane Board
-
ADLINK PCI-7224 - 24-CH Opto-Isolated Digital I/O PCI Board
-
ADLINK CPCI-7433R(G) - Digital Input Board Rear I/O CompactPCI Card
-
ADLINK EBP-13E4 - 51-46703-0A30 Industrial PC Backplane Passive Backplane
-
ADLINK PCIE-HDV62 - Image acquisition card High Definition Video Frame Grabber
-
ADLINK EBP-13E4 - 51-46703-0A30 Industrial Backplane Board Passive Backplane
-
ADLINK 90111-B1 / CPCI-6770 - PCB CPU MODULE CompactPCI Single Board Computer
-
ADLINK PCI-7248 - DATA ACQUISITION PCI CARD 48-CH Parallel Digital I/O Board
-
ADLINK PCI-7230 - 51-12003-0a50 board PCI7230 32-CH Isolated Digital I/O Card
-
ADLINK PCI2A000CB - 51-20000-0B30 Multi-Function DAQ Card Baseboard
-
ADLINK PCI-8134-005 - 4-Axis Motion Controller Card
-
ADLINK PCI-7224 - 24-CH Opto-Isolated Digital I/O PCI Card
-
ADLINK PCI-7434 - 64-CH Isolated Digital Output Card
-
ADLINK PCI-8132 - motion control card 2-Axis Servo & Stepper Controller
-
ADLINK PCI-8134 - Motion Controller PCI Card 4-Axis Controller Board
-
ADLINK PCI-8164 - Motion Control Card 51-12406-0A40 4-Axis Controller
-
ADLINK 51-12001-0C20 - Circuit Board Data Acquisition Interface Module Hardware
-
ADLINK NuPR0-840 - industrial control motherboard Full-Size PICMG CPU Board
-
ADLINK PCI-7444 - 51-12023-0A10 card 128-CH Isolated Digital Output Board
-
ADLINK PCI-1612B - data acquisition card 4-Port RS-232/422/485 Serial Communication Card
-
ADLINK PCI-6208V 009 - 8/16-CH 16-Bit Analog Output Cards PCB-I-E-482=6BX3
-
ADLINK NUPRO-935A/LV - industrial control motherboard Full-Size PICMG SBC Board
-
ADLINK PCI-9114DG - Multi-Function DAQ Card Data Acquisition PCI Card
-
ADLINK ACL-7130 - Data acquisition card Isolated Digital I/O Board
-
ADLINK ABX-6300D-4E1-BP - board ABX6300D4E1BP Video Interface Expansion Card
-
ADLINK CPCI-6940 - CPCI-6940/D1539/M16-0(EA)-000E 6U CompactPCI Processor Board
-
ADLINK NuPRO-760 - industrial control motherboard Half-Size PICMG SBC CPU Board
-
ADLINK IMB-M42H (G)-0020 - industrial control motherboard LGA1155 Micro-ATX Mainboard
-
ADLINK RTV-24 / PCI-MP4S - 51-12519-1C30 4-Channel Real Time Video Capture Board
-
ADLINK PCI-8134 - 4-Axis Servo & Stepper Motion Controller Card
-
ADLINK MXC-6101D - V.PC000.002.ST.00 Box PC Configurable Embedded Computer
-
ADLINK PCI-8134A - 51-12421-0A10 Motion Control Card 4-Axis Controller Card
-
ADLINK DIN-100S / DIN-100SA1 - Technology SCSI-II TB 100-PIN Terminal Block Board
-
ADLINK DIN-812M001 / DIN812M001 - 51-14034-0A1 51140340A1 Terminal Module Breakout Interface
-
ADLINK PCI-8164 - Servo motion control 4-Axis Advanced Controller Card
-
ADLINK PCIe-GIE64 - Acquisition card GigE Vision PoE+ Frame Grabber
-
ADLINK M-302 - Industrial control motherboard ATX PC Board Mainboard
-
ADLINK PCI-8134 - Motion Controller PCI Card 4-Axis Controller Board
-
ADLINK PCI-RTV24 - Image capture card Analog Video Frame Grabber
-
ADLINK PCI-8102 - Motion control card 2-Axis Servo & Stepper Controller Board
-
ADLINK PCI-9112 REV.B1 - Card Multi-Function Data Acquisition Card
-
ADLINK HSI-DI32-M-N / HSL-TB32-M-DIN - Discrete I/O MODULE Distributed Automation Module System
-
ADLINK PCI-7296 - IO card REV.A3 96-CH Parallel Digital I/O Card
-
ADLINK DIN-814P-A4 / 814Y - terminal board Motion Control Interface Block
-
ADLINK DIN-814P-A4 - 51-14056-0A10 PCB-I-E-2736=ZA01 Screw Terminal Board Breakout
-
ADLINK M-322 - motherboard Industrial Control Computer Mainboard
-
ADLINK NUPRO-406 REV:B1 - industrial control motherboard Full-Size PICMG CPU Board
-
ADLINK AMP-204C - card DSP-Based 4-Axis Advanced Pulse-Train Controller
-
ADLINK HPCI14S REV.B1 - industrial computer baseboard 14-Slot Passive Backplane
-
ADLINK PCI-7250 - 8-CH Relay Output & 8-CH Isolated DI PCI Card
-
ADLINK EBP-13E2 - baseplate Passive Backplane Industrial Computer Chassis Board
-
ADLINK LPCI-3488A - PCI-GPIB card 51-12801-0A30 acquisition card IEEE-488 Interface Board
-
ADLINK PCI-6216V-GL - 51-12201-0C30 16-CH 16-Bit Voltage Analog Output Card
-
ADLINK ACL-8454 - 16-CH Isolated Digital I/O & 4-CH Counter Card
-
ADLINK HPCI-9S7U - backplane Passive Backplane Compatible with NuPRO-A301 852 841 842
-
ADLINK DAQ-2010-007 - Simultaneous-Sampling Multi-Function Data Acquisition Card
-
ADLINK MP-C154 - 51-64205-0A10 Motion Control Card 4-Axis Controller Board
-
ADLINK MXE-202/mSSD16B/WiFi-BT - Matrix Rugged I/O Platform Embedded Fanless Computer
-
ADLINK CM-920-R-17 - PC/104-Plus Single Board Computer Module Intel Celeron M
-
ADLINK PCI-7250 NSMP - 8-CH Relay Output & 8-CH Isolated DI Card
-
ADLINK PCI-8164 - 4-Axis Motion Controller PCI Card W/ Cable and Breakout Box
-
ADLINK EMX-100 - Ethernet-based 4-axis Motion Controllers Distributed Motion Module
-
ADLINK PCI-8134A - Press control card 4-Axis Motion Controller Board
-
ADLINK M-845EG REV:3.2 - industrial motherboard Pentium 4 Socket 478 Micro-ATX
-
ADLINK PCI-9114A Rev A2 DG - card High-Resolution Multi-Function Data Acquisition Board
-
ADLINK IEC-915GV - REV 1.1 Industrial motherboard Socket 478 CPU Board
-
ADLINK PCI-9111DG(G) - Data Acquisition Card Multi-Function DAQ Card
-
ADLINK HPCI-15S10 REV:B2 - Industrial computer base plate Passive Backplane Board
-
ADLINK NuPR0-840 / NuPR0-840DV - industrial control motherboard Full-size PICMG CPU Board
-
ADLINK RTV-24 / PCI-MP4S - 51-12519-1C30 4-Channel Real Time Video Capture Board
-
ADLINK NUPRO-780 - industrial control motherboard Pentium III Single Board Computer
-
ADLINK PCI-7296 - 0050 card 96-CH Opto-Isolated Parallel DIO Card Set
-
ADLINK NUPRO-780 - industrial control motherboard PICMG Full-Size SBC
-
ADLINK PCI-7248 - 51-12006-0A3 002 Pci 7248 48-CH Parallel Digital I/O Card
-
ADLINK cPCI-6626 - 6U CompactPCI 2.0 Blades i7-2710QE PCB-I-E-2570=9N41
-
ADLINK MXC-6322D(G) - Industrial Fanless Computer
-
ADLINK cPCI-8168-004 - CompactPci NulPC Motion Control Board 51-36402-0A3
-
ADLINK CPCI-7300[G] - COMPACTPCI Digital I/O Card Data Acquisition
-
ADLINK CPCI-6626/2710/M4G - COMPACTPCI COMPUTER BOARD
-
ADLINK cPCI-8168-009 - cPCI NulPC Motion Control Board
-
ADLINK cPCI-6626/2710/M4G - VME CPU Board Computer Board
-
ADLINK CPCI-R6200(G)-0040 - COMPACTPCI CONTROL BOARD
-
ADLINK CPCI-3840/PM18/M1G(G)-3650 - COMPACTPCI CPU Module Single Board Computer
-
ADLINK cPCI-7248 - 48-CH Opto-22 Compatible Digital I/O Module
-
ADLINK DLAP-211-JNX - NVIDIA Jetson Xavier NX Edge AI Inference Platform
-
ADLINK cPCI-3544 - Series 4-Port RS-422/485 Isolated Serial Communications Card
-
ADLINK CM1-86DX3 - PC/104 SBC Stanley Vortex86DX3 CPU 2GB Ram
-
ADLINK DLAP-211-JNX - NVIDIA Jetson Xavier NX Edge AI Inference Platform
-
ADLINK cPCI-3544 - Series 4-Port RS-422/485 Isolated Serial Communications Card
-
ADLINK CM1-86DX3 - PC/104 SBC Stanley Vortex86DX3 CPU 2GB Ram
-
ADLINK PCI-7433 - switch value acquisition card Isolated Digital Input Card
-
ADLINK PCI-9112 - 51-12252-0D20 Multi-Function Data Acquisition Card
-
ADLINK NUPRO-A301 REV:1.4 - industrial control motherboard PICMG Full-Size SBC
-
ADLINK 51-18502-0A10 - Frame Grabber Image Acquisition Interface Card
-
ADLINK PCI-7296 - 51-12009-0A50 PCB-I-E-925=6DX1 96-CH Parallel Digital I/O Board
-
ADLINK PCI-8132 GP A2 - Motion Control Card 2-Axis Servo & Stepper Controller
-
ADLINK PCI-7442 - switch quantity card data acquisition card 64-CH Isolated Card
-
ADLINK HPX-13S4 - baseboard PICMG 1.3 Passive Backplane Chassis Baseplate
-
ADLINK NuPRO-590 / NTC-567-ZM-F36 - Single Board Computer PCB-I-E-1853=9L21 Half-Size SBC
-
ADLINK PCIe-8332 - 16-axis plate Motion Control Hardware Card
-
ADLINK NuPRO-775 REV.B1 - motherboard Pentium 4 Full-Size PICMG SBC
-
ADLINK PXI-3920 - Embedded Controller 3U PXI cPCI System Intelligence Board
-
ADLINK PCI-8134 - driver card motion control card 4-Axis Controller Board
-
ADLINK HSL-DI32-M-N-011 / HSL-TB32-M-DIN - Digital Input & Base Module PLC Distributed I/O System
-
ADLINK PCI-6216V-206 / PCI-208V 009 - 16 CH 16bit analog output card
-
ADLINK NuPro-E330 - 51-41805-0A20 PCB Single Board Computer Host Board
-
ADLINK PCI-1622C - Card 8-Port RS-232/422/485 PCI Serial Communication Board
-
ADLINK PCIe-7432 - 51-18402-0A10 Carte PCIe Avec Plage D'Entrée Élevée Isolated DIO Card
-
ADLINK PCI-7250 - PCI Acquisition Card 8-CH Relay Output Isolated DI Card
-
ADLINK PCI-7230 - 32-CH Isolated Digital I/O Card
-
ADLINK PCI-8164 - PCB 4-Axis Motion Controller Card
-
ADLINK PCI-7854 - Collection card High-Speed Link Distributed Motion Controller
-
ADLINK NuPRO-935A/LV - industrial control computer motherboard Full-Size PICMG SBC
-
ADLINK IMB-M40H - motherboard IH61-AA4 1155 LGA1155 Micro-ATX Mainboard
-
ADLINK PCI-7248 - Linhua 51-12006-0A40 48-CH Parallel Digital I/O Card
-
ADLINK HPCI-14S12U - Linhua industrial computer baseboard Passive Backplane
-
ADLINK PCI-8132 Rev.A2 - 2-Axis Servo & Stepper Motion Controller Card
-
ADLINK ACL-8111 - ISA card Multi-Function DAQ Card
-
ADLINK ACL-8111 - ISA card Multi-Function Data Acquisition Board
-
ADLINK PCI-7200 REV.A3 - Digital I/O card 12MB/s High-Speed Parallel Digital I/O
-
ADLINK PCI-7296 REV.A3 - 96-CH High-Density Opto-Isolated DIO Card
-
ADLINK PCI-7434 - 64-CH Isolated Digital Output Card

K-JIANG

Add: Jimei North Road, Jimei District, Xiamen, Fujian, China
Tell:+86-15305925923