
K-WANG
+086-15305925923
Service expert in industrial control field!


Product
Article
NameDescriptionContent
Adequate Inventory, Timely Service
pursuit of excellence


Ship control system
Equipment control system
Power monitoring system
Current position:
新闻动态
newS
Brand
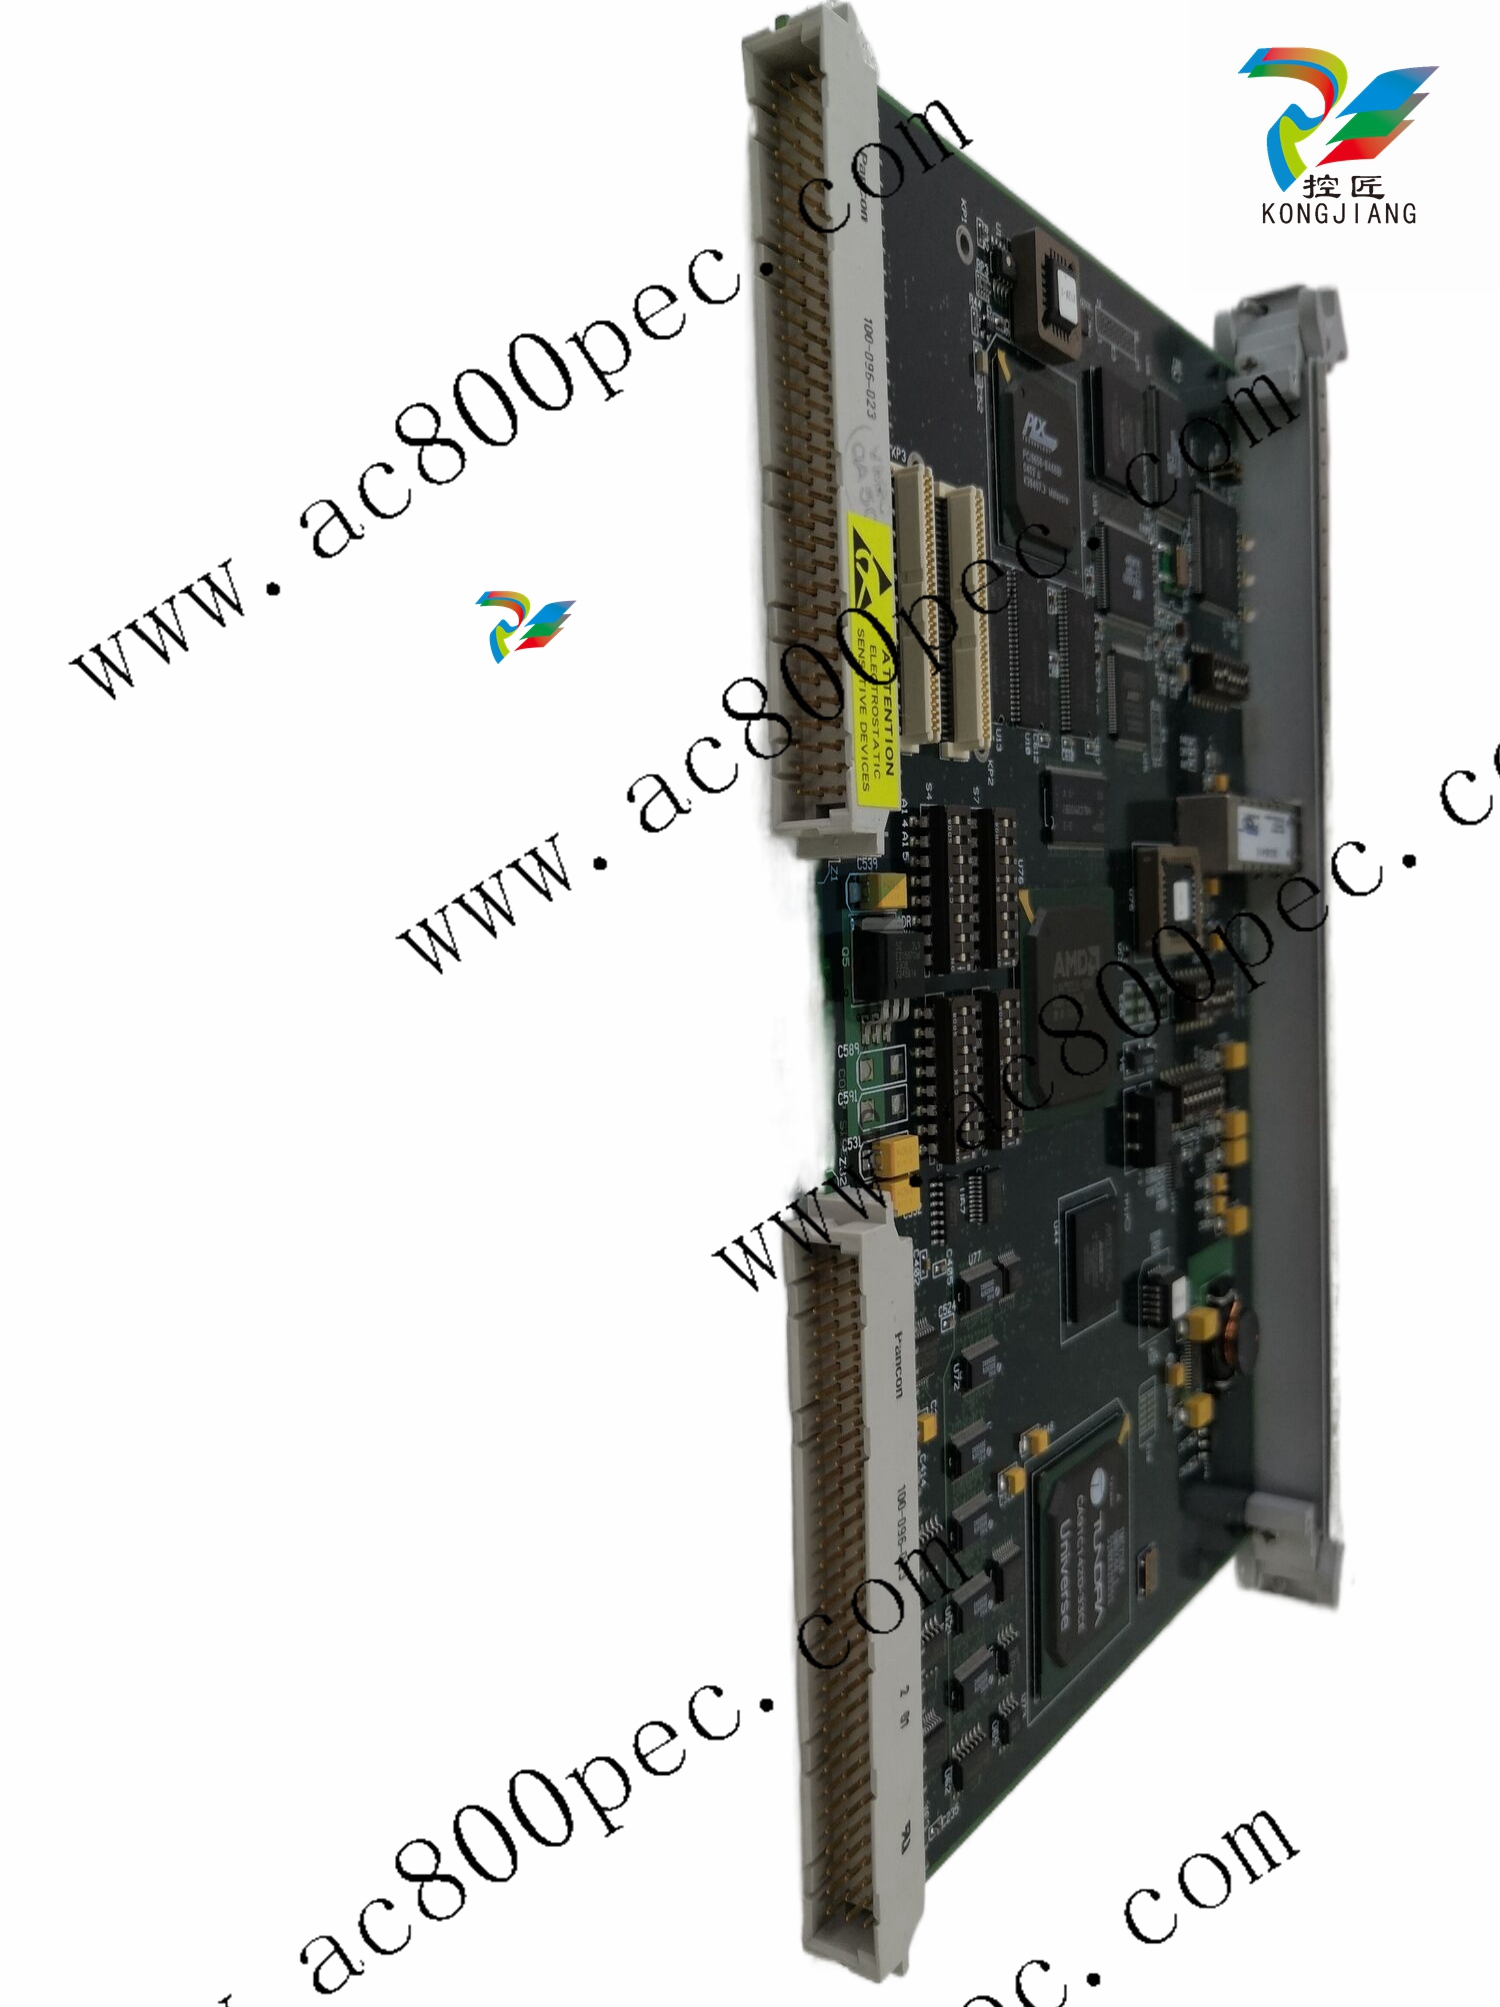
GE VMIVME-2120 64-bit High-Voltage Digital Output Megamodule
GE VMIVME-2120 64-bit High-Voltage Digital Output Megamodule
GE VMIVME-2120 64-bit High-Voltage Digital Output Megamodule
example of a schedule/oven assignment and Figure 4-12 illustrates a typical multi-oven and schedule
relationship.
Table 4-1: Schedule/Oven Assignment Example
Schedule
Assignment
Oven 1 Oven 2 Oven 3 Oven 4
Schedule 1 X X X
Schedule 2 X X
Schedule 3 X
Schedule 4 X
Figure 4-12: Multi-Oven and Schedule Relationship
In each example, a red X represents an offline oven. The offline condition may be initiated for
maintenance, power failure or possible associated equipment failure. In Example A, Oven 4 has gone
offline. Only schedules 1 and 4 are impacted. In Example B, Oven 2 is offline and impacts only
schedules 1 and 2. These schedules react and restart as described in section 4.4.2.
4.4.4 Queue subtab
The Schedule>Queue subtab displays the order of the current and upcoming analyses (see Figure
4-13). Schedules may be created, started, stopped, paused or deleted.
Legend: Schedule>Queue Display
ID Description
1 Action Icons – Create, edit and control schedules (Action Icons in Table 3-1 lists each icon)
2 Queue Display – Lists live analyses associated with the selected schedule (left-hand column)
3 Schedule List – List of schedules
A green entry represents the current running analysis in the selected schedule. Total analysis time
and time into analysis are displayed under the time heading.
A yellow entry identifies the sample that is purging for the next analysis.
A blue entry identifies the stream which is next to be purged.
A white entry identifies any additional Time of Day (TOD) or Demand request in the order of analysis.
The type of stream analysis displayed is defined as follows:
Step: The sequence of stream analyses defined on the Step subtab
Time of Day (TOD): Scheduled stream analyses defined on the TOD subtab
Demand (Ad Hoc): Demand stream analysis requests
Any stream analysis which is blue or white can be deleted from the queue using the selection box and
delete button on the right side of the screen.
When a schedule goes offline, the associated schedule button behaves as follows:
Stopped schedules blink letters white and red; when the schedule comes online, the button
letters turn red.
Running schedules blink letters white and green; when the schedule comes online, the button
letters turn green.
Paused schedules blink letters white and yellow; when the schedule comes online, the button
letters turn yellow.
4.4.5 Step subtab
Figure 4-14 shows the Step subtab display. It allows the user to add steps to a schedule
Legend: Schedule>Step display
ID Description
1 Schedule select: Select schedule to show detail.
2 Add Action icon: Press the Add icon to add an analysis.
3 Analysis control area: Add, Delete, Run and Activate.
To add an analysis:
1. Press the Add icon.
2. Select the stream and press the Next button to continue.
3. Select the analysis and press the Next button to continue. Press the Go Back button to go back
or press the Abort button to cancel.
4. Press the Accept button to accept the selection. Press the Go Back button to go back or press
the Abort button to cancel.
When accepted, the analysis will be added to the schedule on the Step screen. Check the ACTIVE box
to activate.
4.4.6 Time of day subtab
The Schedule>TOD subtab displays the currently configured analyses, the streams they use, the
frequency at which they run, and whether they are being actively used (see Figure 4-15). It allows
frequency configuration at monthly, weekly, daily, hourly, minute or second intervals.
- YOKOGAWA
- Reliance
- ADVANCED
- SEW
- ProSoft
- WATLOW
- Kongsberg
- FANUC
- VSD
- DCS
- PLC
- man-machine
- Covid-19
- Energy and Gender
- Energy Access
- Renewable Integration
- Energy Subsidies
- Energy and Water
- Net zero emission
- Energy Security
- Critical Minerals
- A-B
- petroleum
- Mine scale
- Sewage treatment
- cement
- architecture
- Industrial information
- New energy
- Automobile market
- electricity
- Construction site
- HIMA
- ABB
- Rockwell
- Schneider Modicon
- Siemens
- xYCOM
- Yaskawa
- Woodward
- BOSCH Rexroth
- MOOG
- General Electric
- American NI
- Rolls-Royce
- CTI
- Honeywell
- EMERSON
- MAN
- GE
- TRICONEX
- Control Wave
- ALSTOM
- AMAT
- STUDER
- KONGSBERG
- MOTOROLA
- DANAHER MOTION
- Bentley
- Galil
- EATON
- MOLEX
- Triconex
- DEIF
- B&W
- ZYGO
- Aerotech
- DANFOSS
- KOLLMORGEN
- Beijer
- Endress+Hauser
- schneider
- Foxboro
- KB
- REXROTH
- YAMAHA
- Johnson
- Westinghouse
- WAGO
- TOSHIBA
- TEKTRONIX
- BENDER
- BMCM
- SMC
- HITACHI
- HIRSCHMANN
- XP POWER
- Baldor
- Meggitt
- SHINKAWA
- Other Brands
- UniOP
- KUKA
- IBA
- Beckhoff
- ADLINK
91
-
Beckhoff AX5118-0000 - Servo Drive Module
-
Beckhoff CP2921-2000-0000 - Multi-Touch Control Panel
-
Beckhoff CX1020-0000 - CX1020-N000 CX1100-0001 Controller Set
-
Beckhoff CX8110 - 000007735 Embedded PC
-
Beckhoff CP7031-0002-0000 - CP-Link Interface Control 12.1" Panel
-
Beckhoff AX8118-0200-0000 - Single-Axis Module Motion Drive
-
Beckhoff CX2030-1020 - Basic CPU Module
-
Beckhoff CX5120-0125 - Embedded PC
-
Beckhoff CP2913-0000 - Multi-Touch Display 12.1" 1280 x 800 DVI USB 24VDC
-
Beckhoff CP6902-0001-0000 - Operator Interface 15" CP690200010000
-
Beckhoff ELM3502-0000 - EtherCAT Measurement Terminal 2-channel analog input
-
Beckhoff CX1030-0012 - CPU Module with CX1100-0014 CX1030-N041 CX1030-N030 N000
-
Beckhoff CP3915-0000 - 15" HMI Multi-Touch Panel
-
Beckhoff CU8803-0001 - CU8803-0000 Rev 2.2 Transmitter Box CP-Link 4
-
Beckhoff CX2030-0125 - CPU Module Embedded PC Windows PLC Controller
-
Beckhoff CX1020-0122-1001 - Multivac 105808023 CPU Module
-
Beckhoff CX2020-0121 - Embedded PC Module
-
Beckhoff KL3162 - PLC Module 2-channel analog input terminal
-
Beckhoff CP6607-0001-0020 - Built-in Panel PC Touchscreen 5.7" Arm Cortex-A8 1 GHz
-
Beckhoff EL3751 - EtherCAT Terminal 1 Channel Analog Input Multifunction 24 Bit
-
Beckhoff CX1010-0012 - CPU Module CX1010-0012
-
Beckhoff EL6631 - EtherCAT 2-Port Communication Interface Profinet RT Controller
-
Beckhoff C1510.1 - Interface Card
-
Beckhoff CX8080 - Embedded PC PLC Module
-
Beckhoff EL3218 - EtherCAT Terminal 8-Channel Analog Input
-
Beckhoff CP6700-0500 - Panel Control Flash PC Touch Screen 10.1" HMI
-
Beckhoff CP7011-1002-0010 - Polaris Operator HMI Display 30.5 cm
-
B&R 5AP920.1505-01 - TFT Display With Touch Screen
-
Beckhoff EL3351 - PLC Module Thermocouple Input Terminal
-
Beckhoff AM8052-0JH1-0000 - Servo Motor
-
Beckhoff CX5140-0135 - 4GB High-Performance Embedded Industrial PC
-
Beckhoff EP7211-0034 - EtherCAT Box 1 Channel Motion Interface
-
Beckhoff CX1020-0121 - CPU Module with CX1100-0002 CX1020-N010 N000
-
Beckhoff CX5140-0100 - 4GB Embedded PC
-
Beckhoff CP7711-0001-0030 - Industrial Computer Detection Panel
-
Beckhoff CX1020-0122 - CX1020-N030 CX1020-N010 CX1020-N000 CPU Module
-
Beckhoff CP6907-1000-0000 - Control Panel HMI
-
Beckhoff CX1020-0122 - CX1020-N030 CX1020-N000 CPU Module
-
Beckhoff CX2020-0123 - Embedded PC with CX2100 Power Supply
-
Beckhoff BX5100-0000 - Bus Terminal Controller Bus Coupler
-
Beckhoff C6930-0050 - Industrial Computer
-
Beckhoff CP6606-0001-0020 - Industrial Panel PC
-
Beckhoff CX9020-0115 - PLC Module CX90200115
-
B&R X20-SL-8000 - Ethernet Powerlink X20 Safety Controller Module Rev H0
-
Beckhoff CX2020-0155 - CPU Basic Module + Power Supply Module CX2100-0004
-
Beckhoff EJ7211-0010 - EtherCAT Plug-in Module Servomotor Motion Interface
-
Beckhoff C6920-0010 - Industrial PC Computer
-
Beckhoff CX1020-0112 - CPU Module with CX1020-N010 CX1020-N000 CX1100-0004
-
Beckhoff AX5203-0000 - Servo Driver Module
-
Beckhoff C6640-0050 - Industrial PC Intel Core i7-6700 3.4GHz CB1064-0002 Board
-
Beckhoff CX1020-0112 - CPU Module with CX1020-N000 CX1020-N010 CX1020-N030
-
Beckhoff CP6201-0001-0020 - Panel PC 24VDC
-
Beckhoff CX2020-0122 - Embedded PC Controller
-
B&R 5PC810.SX02-00 - Controller PC
-
B&R 4PP220.1043-K08 - REV G HMI Touch Panel 10.5in
-
B&R X20CP1586 - CPU Module
-
Beckhoff CX2040-0155 - Basic CPU Module Along with 40GB Card V 964
-
Beckhoff EL6652 - EtherCAT Terminal EtherNet/IP Master Scanner Rev 0018
-
Beckhoff C6650-0060 - Industrial PC
-
Beckhoff EP2328-0002 - EtherCAT Box 4-channel digital input 4-channel digital output
-
Beckhoff CX5120-0135 - Embedded PC CPU Module Intel Atom Processor 2GB RAM
-
Beckhoff CP7037-1037-0010 - Operator Interface Touchscreen
-
Beckhoff CX5140-0100 - 4GB Embedded PC
-
Beckhoff C5240-0020 - 000224115 Plc Module
-
Beckhoff CX5140-0100 - 4GB Embedded PC
-
Beckhoff EL2911 - 4 Channel Digital Input + 1 Channel Digital Output Module
-
Beckhoff CX1020-0000 - CX1020-N000 Automation Controller
-
Beckhoff CP2918-0000 - Control Panel HMI
-
Beckhoff CX2020-0122 - Embedded PC Controller
-
Beckhoff C6640-0040 - Control Cabinet Industrial PC 7-Slot
-
Beckhoff CP6201-0001-0020 - Touch Display Panel with Accessories
-
Beckhoff CP6207-0001-0020 - Panel PC 24VDC
-
Beckhoff C6930-1062-0050 - Control Cabinet Industrial PC
-
Beckhoff CP2712-1002-0000 - Baumann Automation Touch Control Panel
-
Beckhoff EL6631-0010 - EL66310010 Module PLC PROFINET RT Device
-
Beckhoff BK9000 - Ethernet TCP/IP Bus Coupler
-
Beckhoff CX5140-0175 - Embedded PC
-
Beckhoff CP2912-0000 - 12.1" Touch Screen Display CP29120000 24VDC
-
Beckhoff CP2712-1002-0000 - Baumann Automation Touch Control Panel
-
Beckhoff EK1100 - EtherCAT Coupler Reseller Lot of 38 with EK1122
-
Beckhoff KL1414 - 4-Channel Digital Input 24V DC 0.2ms 10 Piece Box
-
Beckhoff CP6533-0001-0060 - Control Cabinet PC Panel
-
Beckhoff EK9500 - EtherNet/IP Bus Coupler
-
Beckhoff CP6202-1047-0050 - Built-in Panel PC
-
Beckhoff C6017-0010 - Ultra-Compact Industrial PC Serial 000sndlk
-
Beckhoff C6650-0040 - Industrial PC
-
Beckhoff CX5230-0185 - 000119805 PLC Module 3D-71
-
Beckhoff EL3773 - Power Monitoring EtherCAT Terminal PLC Module
-
Beckhoff EL4732 - EtherCAT Terminal 2-channel analog output Pack of 10
-
Beckhoff CX1001-0120 - CPU Module cx10010120 cx1000-n001 cx1000-n000
-
Beckhoff CP6202-0001-0020 - Industrial Panel PC Atom Z530 32GB SSD 1GB RAM
-
Beckhoff CX5140-0175 - Embedded PC Intel Atom E3845 4GB RAM + 40GB CFast Card
-
Beckhoff EL3751 - EtherCAT Terminal 1 Channel Analog Input Multifunction 24 Bit
-
Beckhoff CP6202-0001-0010 - Economy Built-In Panel PC with HDD
-
Beckhoff C6320-M554 - Industrial PC
-
B&R 2AT300.6 - Analog Input Module 8x PT100
-
Beckhoff AX5206-0000-0202 - Digital Compact Servo Drive 2-axis
-
Beckhoff CX1020-0111 - CX1020-N000 CX1020-N010 CX1020-N030 CPU Module Bundle
-
Beckhoff CP6606-0001-0020 - Panel PC HMI
-
Beckhoff CX2020-0155 - CPU Basic Module + Power Supply Module CX2100-0004
-
Beckhoff CP2712-0000 - Panel 12.1" 24VDC CP27120000
-
Beckhoff C6150 - Control Cabinet PC
-
Beckhoff CP7711-0001-0030 - Industrial Computer Detection Panel
-
Beckhoff CP2913-0000 - Multi-Touch Display 12.1" 1280 x 800 DVI USB 24VDC
-
Beckhoff EK1322 - EtherCAT P Junction Module
-
Beckhoff CP6500-1012-0060 - 14250369 Control Cabinet PC
-
Beckhoff CP7902-0001-0000 - Control Panel HMI
-
Beckhoff EL6631-0010 - EL66310010 Module PLC PROFINET RT Device
-
Beckhoff CP2712-1002-0000 - Baumann Automation Touch Control Panel
-
Beckhoff C6920-0010 - Industrial PC Core Duo 2.00 GHz
-
Beckhoff C3640-0050 - Industrial PC
-
Beckhoff CX5140-0100 - 4GB Embedded PC
-
Beckhoff C6015-0010 - Ultra-Compact Industrial PC
-
Beckhoff KL3001 - PLC Module Analog Input Bus Terminal
-
Beckhoff CP7711-0001-0030 - Industrial Computer Detection Panel
-
Beckhoff AX5106-0000-0200 - Digital Compact Servo Drive 1-axis
-
Beckhoff CP2712-0000 - 12.1" 24VDC Touch Screen CP27120000
-
Beckhoff CP7037-1037-0010 - Operator Interface Touchscreen
-
Beckhoff CP7711-0001-0030 - Industrial Computer Detection Panel
-
Beckhoff C6220 - Industrial PC with Beckhoff FC3101 240 Volt
-
Beckhoff EL3164 - 4X Analog Input EtherCAT Terminal
-
Beckhoff C6140 - Husky PC 11 Industrial PC 160GB HDD Intel P3 850MHz w SERCOS 24V
-
Beckhoff KL6023-0000 - KL6023 EnOcean Wireless-Adapter
-
Beckhoff C3620-0000 - Industrial PC Motor Shelves
-
Beckhoff CX2020-0120 - PLC Module & CX2100-0004 PLC
-
Beckhoff Monitor - Industrial Display Screen
-
Beckhoff CP6020-0000-0000 - Touch Panel Screen
-
Beckhoff EK1960-0000 - TwinSAFE Compact Controller

K-JIANG

Add: Jimei North Road, Jimei District, Xiamen, Fujian, China
Tell:+86-15305925923