
K-WANG


Zygo Profilometer Standard Operating Procedure
Zygo Profilometer Standard Operating Procedure
Core positioning and equipment principles
1. Purpose and Scope of Application
Equipment function: Zygo profilometer is a 3D optical profilometer that uses scanning white light interferometry technology to achieve rapid non-contact measurement of surface texture, shape, and step height. It is suitable for high-precision detection of small samples such as MEMS devices, semiconductor wafers, and microstructure surfaces.
Measurement principle: White light is divided into a "reference light path" (pointing towards the internal reference surface) and a "measurement light path" (pointing towards the measured surface). The irregularity of the surface causes a difference in the optical path length between the two light paths, which recombines to produce "interference fringes" with alternating brightness and darkness; Capture the light intensity of each pixel point through Z-axis scanning and convert it into height data for analysis.
2. Equipment and consumables
The control computer with Windows system as the core device (pre installed with ZeMaps software) is not connected to the network and only stores measurement recipes, without saving user data
Auxiliary tool sample tweezers are used to gently pick up small samples to avoid contamination/damage
Data storage USB flash drive is used to export user measurement data (system computers do not allow long-term storage of large amounts of data)
Safety regulations (core precautions)
During the operation, the following safety rules must be strictly followed to avoid equipment damage and personnel risks:
Optical component protection: Do not touch the objective lens, as dust and fingerprints can damage the optical coating and affect imaging accuracy;
Z-axis collision prevention:
Before placing the sample, the stage needs to be driven to the "Unload Position";
For conventional wafer samples, the Z-axis stop should be set to 87.5mm, and for abnormally thick samples, NanoFab staff should be contacted to adjust the limit;
When operating the Z-axis (focusing/adjusting height), it is necessary to move slowly to avoid collision between the objective lens and the sample/stage;
Sports safety: When moving the Z-axis, stay away from the equipment column to avoid getting hands, hair, etc. involved in moving parts;
Emergency Stop: Clearly locate the "Emergency Stop Button" and press it to immediately stop all Z-axis movements.
Device Setup Process (Startup and Initial Configuration)
1. Software startup and window familiarity
Start the ZeMaps software and after initialization, display 4 core operation windows, each with the following functions:
Window Name Core Function Key Operating Points
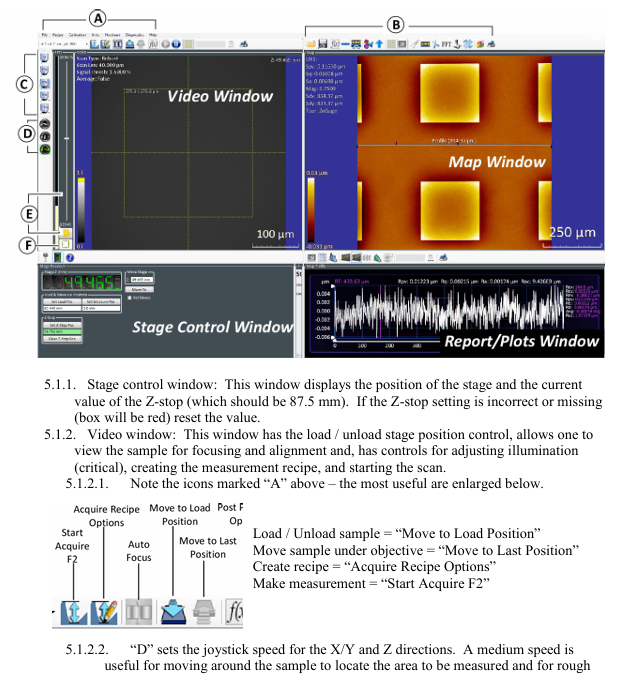
The Stage Control Window displays the position of the stage and the Z-stop value. The Z-stop value is confirmed to be 87.5mm. If the value is incorrect or displayed in red, it needs to be reset
Video Window Stage Loading/Unloading Control, Sample Focusing/Alignment, Light Intensity Adjustment, Measurement Formula Creation, Scan Start with Core Function Icons: "Move to Load Position", "Start Acquire F2", etc
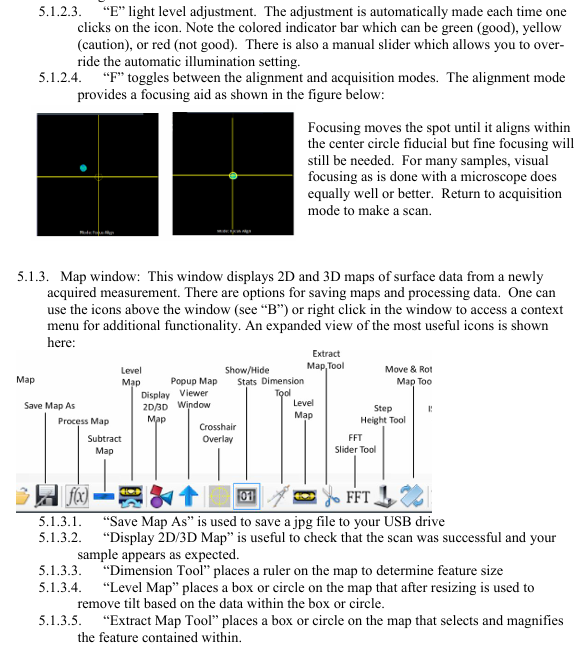
The Map Window displays 2D/3D surface data maps and supports data saving, tilt correction, and area enlargement. Common icons include "Save Map As", "Level Map", and "Dimension Tool"
The Report/Plots Window displays the "Profile" and supports elevation, caliper measurement, statistical analysis, adjustable Y-axis range, and adding marker points to measure step height/width
Description of Key Function Icons in Video Window:
Group A icons: "Move to Load Position", "Move to Last Position", "Acquire Recipe Options", "Start Acquire F2";
D (joystick speed): Medium speed is used for X/Y axis movement to find the sample area and coarse focusing; Low speed is used for precise focusing and observation of interference fringes;
E (light intensity adjustment): Automatic adjustment (triggered by clicking the icon), displaying the light intensity status through green/yellow/red indicator lights, or manually sliding the slider to cover the automatic setting;
F (Mode Switching): "Alignment Mode" is used to assist in focusing (aligning the spot with the center reference circle), and "Acquisition Mode" is used for formal scanning (which requires switching back to this mode for measurement).
2. Z-axis limit (Z-stop) calibration
Operation: Use the joystick to move the Z-axis to a safe position (standard 87.5mm), click the "Set Z Stop Pos" button in the "Stage Control Window" to complete the Z-axis limit setting (to prevent collision with the sample when the Z-axis moves down later).
Core operational steps (measurement and analysis)
1. Sample measurement process (Section 6.1)
Step 1: Sample placement and stage positioning
Drive the stage to the "Load Position" and gently place the sample on the stage with tweezers;
Click on 'Move to Measurement Position' to move the sample directly below the objective lens.
Step 2: Coarse focus and area positioning
Set the joystick speed to "medium speed" (X/Y/Z axis), and align the "region of interest (ROI)" with the objective lens by moving it along the X/Y axis;
Rotate the joystick to control the Z-axis (clockwise: Z-axis rises away from the sample; Counter clockwise: Z-axis descends towards the sample), observe the video window, and when the sample starts to focus, switch the joystick speed to "low speed" to avoid collision.
Step 3: Adjustment of light intensity and interference fringes
Click on the "Light Level Adjust" icon to automatically adjust the light intensity, ensuring that the indicator light is green (appropriate light intensity);
Continue to fine tune the Z-axis until the video window clearly displays the sample structure, while observing the "interference fringes" (some samples need to switch to alignment mode to assist in focusing, and after focusing, switch back to acquisition mode).
Step 4: Measure Recipe Creation
Scanning length setting: slightly larger than the sample step height (if the sample has a large step, the Z-axis height of the "top" and "bottom" should be recorded separately to ensure that the scanning range covers the complete features);
Scan starting point selection:
Top: Scan down from the current position to set the length;
Center: First move up half of the scanning length, and then scan down the entire length;
Bottom ": First move the entire scan length upwards, then scan downwards.
Step 5: Start measurement
Confirm the final light intensity (ensuring that the top/bottom light intensity indicator lights of the sample are mainly green) and focus status, and start scanning through the formula interface or the "Start Acquire F2" icon;
After scanning is completed, the data is automatically displayed in the "Map Window" (2D/3D map) and "Report/Drawing Window" (profile).
2. Measurement data analysis process (Section 6.2)
After the scanning is completed, the data needs to be corrected and quantitatively analyzed. The core steps are as follows:
Step 1: Data validity verification
Use the "2D/3D Display Tool" in the "Map Window" to check if the sample image meets expectations. If it is blurry/missing, adjust the light intensity and focus again before re capturing.
Step 2: Tilt Correction (Level Map)
Select the "known flat area" on the sample, click the "Level Map" tool, draw a box/circle to cover the area, click "Remove" to remove the tilt, and ensure the accuracy of the step height measurement reference.
Step 3: Region enlargement and size measurement
Region zoom in: Use the "Extract Map Tool" to draw a box in the map window and zoom in on the area of interest (to cancel zoom in, left click on any position in the window);
Size measurement: Click on "Dimension Tool" and the map window will display a ruler. Move the ruler to measure the characteristic dimensions of the sample (such as microstructure diameter and spacing).
Step 4: Profile analysis (key step)
Retrieve Profile: Right click on "Show Profile Tool" in the map window, place the Profile Bar, and the area between the blue markers at both ends of the line will be displayed in the "Report/Plot Window";
Section correction: Right click on "Level Using Leveling Tool" in the drawing window, adjust the position of the yellow dashed box to achieve section tilt correction, and then right-click "Turn Leveling Off" after completion;
Quantitative measurement:
Step height: Right click on "Show Tag Tool", move the purple cursor to both sides of the step, and the height difference will be displayed on the right side;
Step width: Right click on "Show Caliper" and place a caliper to measure the width;
Axis range adjustment: Drag the Y-axis triangle marker to zoom in and out of the height range to display details clearly.
3. Data saving and operation closure (Sections 6.3-6.4)
Data saving: Right click "Save As" in the map/drawing window and export the data to a USB flash drive in JPG format (storage on the system computer is prohibited);
Closing operation:
Drive the stage to the "Load Position" and use tweezers to remove the sample;
Close the ZeMaps software, disable the motor, and ensure that the device is in a safe standby state.
Data Example
The document provides a measurement case of silicon-based etching "Donut" structure:
Map window (2D/3D): displays the overall morphology of the circular etching area, annotates key parameters (such as Spv=76.876 μ m, Sq=35.808 μ m, which are the maximum peak height and root mean square height, respectively);
Profile window: displays the height contour at the profile line, has completed tilt correction, and the blue mark corresponds to the measurement range of the map window profile line. The step height and width can be read.
Summary of core precautions
Data storage: If the system computer is not connected to the internet and does not store user data for a long time, it is necessary to export measurement results in a timely manner via USB;
Collision prevention priority: Z-axis limit (87.5mm) is the core safety setting. Abnormal thick samples need to be adjusted by contacting staff and unauthorized modifications are prohibited;
Optical cleaning: The objective lens needs to be kept clean, only using specialized cleaning tools (such as lint free cloth+isopropanol), and direct touch is prohibited;
Mode switching: The alignment mode is only used for auxiliary focusing, and must be switched back to the acquisition mode before formal measurement, otherwise effective data cannot be generated.
- YOKOGAWA
- Reliance
- ADVANCED
- SEW
- ProSoft
- WATLOW
- Kongsberg
- FANUC
- VSD
- DCS
- PLC
- man-machine
- Covid-19
- Energy and Gender
- Energy Access
- Renewable Integration
- Energy Subsidies
- Energy and Water
- Net zero emission
- Energy Security
- Critical Minerals
- A-B
- petroleum
- Mine scale
- Sewage treatment
- cement
- architecture
- Industrial information
- New energy
- Automobile market
- electricity
- Construction site
- HIMA
- ABB
- Rockwell
- Schneider Modicon
- Siemens
- xYCOM
- Yaskawa
- Woodward
- BOSCH Rexroth
- MOOG
- General Electric
- American NI
- Rolls-Royce
- CTI
- Honeywell
- EMERSON
- MAN
- GE
- TRICONEX
- Control Wave
- ALSTOM
- AMAT
- STUDER
- KONGSBERG
- MOTOROLA
- DANAHER MOTION
- Bentley
- Galil
- EATON
- MOLEX
- Triconex
- DEIF
- B&W
- ZYGO
- Aerotech
- DANFOSS
- KOLLMORGEN
- Beijer
- Endress+Hauser
- schneider
- Foxboro
- KB
- REXROTH
- YAMAHA
- Johnson
- Westinghouse
- WAGO
- TOSHIBA
- TEKTRONIX
- BENDER
- BMCM
- SMC
- HITACHI
- HIRSCHMANN
- XP POWER
- Baldor
- Meggitt
- SHINKAWA
- Other Brands
- UniOP
- KUKA
- IBA
- Beckhoff
- ADLINK
-
Beckhoff CX1100-0910 - Power Supply Module
-
Beckhoff C5210-0010 - Communication Module C5210
-
BECKHOFF KL1352 - Bus Terminal SET OF 2 FREE FAST SHIP
-
Beckhoff EL3058 - 8 x analog input single ended 4...20mA 85惟 shunt 12bit
-
Beckoff CX1100-0920 - UPS Module 24VDC (US SELLER) * *
-
BECKHOFF C6920-0000 - C69200000 PLC Moudule
-
Beckhoff CX5120-0115 - CPU controller module CX5120-0115
-
Unknown 15F5C1E-Y50A - Of Frequency Converters
-
Beckhoff AX5118-0000-0200 - Servo Drive HTP0
-
BECKHOFF AX5106-0000-0200 - Servo Drive
-
Beckhoff CX5240-0175 - Module (free) #U2327D YG
-
Beckhoff CP6607-0001-0000 - Compact PC Panel Economy Installation Operator 5,7 "
-
Beckhoff EP3744-0041 - 2022 EP37440041 Module
-
Beckhoff CP6209-0001-0020 - 6.5" PC Touch Screen Control Panel 24VDC
-
Beckhoff CX9020-0111 - /U900 +8x+2xEL3121+1x EL9410+3xEL1008+1x EL2008 Set
-
Beckhoff C6525-1030-0050 - Industrial PC
-
Beckoff CX1100-0920 - UPS Module 24VDC (US SELLER)
-
Beckhoff CX5010-0120 - CX5010 Processor Intel Atom Z510 B24
-
Siemens 6FC5203-0AF04-1BA1 - Operation Panel
-
Beckhoff CX5230-0175 - / 000029724 Embedded PC / Industrial PC on Rail
-
Beckhoff CP3916-0000 - industrielles Anzeige- und Bedienterminal
-
BECKHOFF CX1500-M310 - CX1000-N000 CX1000-0011 CX1000-C00L CX1100-0002 PLC Module
-
Beckhoff EL1872 - 16-channel digital input terminal
-
BECKHOFF EP2318-0001 - module
-
Beckhoff CX9020-0110 - Basic CPU Module
-
Beckhoff EL2564 - EtherCAT Terminal, 4-channel LED output, 5鈥?8VDC, 4A, RGBW
-
Beckhoff CX5130-0155 - /000105637 Automation Embedded PC
-
B&R 400 - Power Control Panel Rev D0 24 VDC
-
Beckhoff CX2020-0155 - module
-
Beckhoff CX9020-0115 - PLC Module
-
BECKHOFF EL6695 - PLC EL 6695
-
BECKHOFF EL7047 - PLC Modules
-
Beckhoff CX1000-0012 - Control HW 2.2 + CX1500-M310 + CX1000-C00L + CX1100-0002+
-
Beckhoff C6920-1039-0030 - control cabinet industrial PC CPU Celeron 1.90 GHz, 2 cores
-
BECKHOFF CX1100-0910 - PLC Module#
-
Beckhoff IL2301-B318-0000 - Coupler Box 4 Channel Digital Input |
-
Beckhoff CX7080 - Module
-
Beckhoff C6930-0060 - Industrial PC
-
Beckhoff CP7902-1060-0000 - Touchscreen 15 " CP7902
-
beckhoff CX9020-0111 - Controller module or UPS
-
Beckhoff CX8091 - PLC Module CX8091
-
Beckhoff C6640-1008-0030 - Control Cabinet Industrial PC
-
BECKHOFF CX1100-0920 - module
-
Beckhoff C9900-M921 - see pictures
-
BECKHOFF CP6829-0001-0000 - Touch Panel
-
BECKHOFF C6930-0060 - Industrial Computer
-
BECKHOFF CX8050 - PLC module
-
Beckhoff CP6202-0021-0020 - Touch Screen #
-
BECKHOFF AM3031-0C20-0000 - SERVO MOTOR
-
Unknown BCH1302N11A1C - Servo motor
-
Beckhoff EL2502 - 2-channel pulse width output terminal
-
Beckhoff EL6731 - Profibus Master / *Rev: 0025
-
Beckhoff CP3918-0010 - Control Panel
-
BECKHOFF CP2915-0010 - [24 MONTH WARRANTY] Control Panel
-
Beckhoff AX5203-0000-0202 - Servo Drive
-
Schneider TSXDSY64T2K - PLC OUTPUT MODULE
-
Beckhoff EP4174-0002 - Module-
-
Beckhoff IL2302-B318-0000 - Profibus Box
-
Beckhoff CP6709-0001-0000 - Touchpanel
-
BECKHOFF CX2030-0123 - Controller
-
Beckhoff CX9020-0111 - Processor Module
-
Beckhoff CX1020-0000 - CX Basic CPU Module
-
Beckhoff AX2003-AS - Servo Drive HTP0
-
Beckhoff C6240-1052-0040 - 4-086-06-3073 Industrial Computer CB1052-0003
-
Beckhoff EL1918 - 8 xTwinSAFE Input
-
Beckhoff AM8072-0R20-0000 - Servomotor
-
BECKHOFF AM8021-1B21-0000 - servo motor #T882 YS
-
Beckhoff EL6224 - 4 X Terminal IO-LINK
-
Beckhoff CX5140-0135 - embedded PC with Intel Atom processor 4 GB HW 3.6
-
Beckhoff CP7201-1000-0000 - Panel PC #
-
Beckhoff CX5130-0121 - Embedded-PC 4GB CPU Module HW 2.5 Industrial PC
-
Beckhoff AM8022-0D41-1002 - Servomotor
-
BECKHOFF CX2030-0130 - Module
-
BECKHOFF EL1872 - 16-channel digital input terminal
-
Unknown GXMMW.A203P33 - 1pc encoder
-
Beckhoff EL6631-0000 - EtherCAT Terminal 2-Port EL 6631
-
BECKHOFF C6925-0030 - Industrial Computer
-
Beckhoff CX8190 - A Module
-
BECKHOFF CX2040-0135 - CX2040-0135/000000927 CPU BASE MODULE i7 2715QE 2.1GHz --
-
BECKHOFF KL6023-0000 - Wireless adapter
-
Saia Burgess PCD7.F700 - PCD7F700 Communication Module
-
Beckhoff CX5130-0112 - CPU Module
-
BECKHOFF CX1020-N010 - CX1020-N000 CX1020-0111 CX1100-0004 EL2008 EL3064 EL4004
-
Beckhoff EP1819-0021 - A Module
-
Beckhoff CX2030-0120 - / 4gb with CX2100 0004
-
B&R X20-XC-0292 - Automation Powerlink Ethernet Bus Controller Module
-
Beckhoff BK3110 - One PLC Module
-
BECKHOFF KL3222 - PLC Module
-
BECKHOFF CX1500-M310 - CX1000-N000 CX1000-0011 CX1000-C00L CX1100-0002 PLC MODULE
-
Beckhoff CP3918-0010 - Control Panel
-
Beckhoff CX2030-0100-1002 - /4GB + CX2100 + CX2550 + CX2500-0060 + SSD
-
Beckhoff EP1816-0008 - PLC Module
-
Beckhoff CX5130-0112 - Module
-
Beckhoff Cx1500-m750 - CPU Hw: 1.4
-
BECKHOFF AX5112-0000-0200 - AX511200000200 Servo Driver
-
Beckhoff EL3751 - EtherCAT Terminal 1 Channel Analog Input Multifunction 24 Bit
-
Beckhoff CX1100-0002 - Power Supply Module
-
Beckhoff CP3916-1016-0010 - Control Panel
-
BECKHOFF CX9001-1101 - #NAME?
-
Beckhoff EP3174-0002 - EtherCAT Box Module
-
Beckhoff C6030-0070 - servo drive
-
Beckhoff CX2020-0120 - /4GB CPU, CX2100-0904, 3x EL6900, EL1904, 16GB Memory
-
BECKHOFF C6110 - BOX-PC 113608
-
BECKHOFF EK1914 - module #P
-
Beckhoff C6140 - Ipox IP-4GVI63 + CH7009A_DVI_TV + SIEMENS A5E00369843 + WD800AAJB
-
Beckhoff CX5020-0111 - controller Good quality
-
BECKHOFF C6015-0010 - / 6559380 ULTRA-COMPACT INDUSTRIAL PC ()
-
Beckhoff AX5203-0000-0200 - PLC module
-
Beckhoff EL2872 - 16-channel digital output terminal
-
BECKHOFF C3640-0000 - Panel Industrial PC 100/240VAC 128MB E0122L
-
Beckhoff CX8031 - Module
-
Beckhoff CX5020-0120-1002 - PLC module#
-
Beckhoff C6140 - M845B + SIEMENS A5E00369843 + C9900_A159_1 + AUTOMATA CAN PCI 1N
-
BECKHOFF AX5112-0000-0200 - Servo Drive*ie
-
B&R ECPA42-01 - Analog Output Module 4-Channel, +/- 10V Output Signal, 20mA Max
-
Beckhoff EL6631-0010 - PLC Module
-
BECKHOFF C6930-0070 - CONTROL CABINET INDUSTRIAL PC
-
BECKHOFF AX5112-0000-0200 - AX511200000200 Servo Driver
-
BECKHOFF EK9000 - Programmable Logic Controller Module EK9000 EK9000
-
BECKHOFF C6920-1028-0000 - Industrial computer
-
Beckhoff CX2030-0120 - controller Module
-
Beckhoff BX8000-0000 - Bus Terminal Controller HW 4.4
-
B&R 3NC154.60-2 - Positioning Module#
-
BECKHOFF CX1020-0122 - PLC module
-
Beckhoff AM3032-0D40-0000 - Servo Motor
-
BECKHOFF CX5020-0111 - CPU Module CX5020-0111
-
Beckhoff CB1051 - G5 Motherboard
-
BECKHOFF KL2641 - 1-channel relay output terminal

K-JIANG

Add: Jimei North Road, Jimei District, Xiamen, Fujian, China
Tell:+86-15305925923